Tips.
In this lab you will measure induced emf. You will discover that emf is induced not only in circuits where you intend to measure it but also in connecting wires etc. To avoid getting confusing signals originating from induced emf in connecting wires lay them close together and/or wrap together to avoid unwanted induced emf. Avoid creating unintended loops that may induce emf from moving magnets.
Experiment 1: Electric generator.
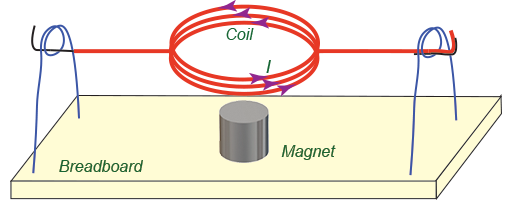
We will not make quantitative measurements and calculations in this Experiment. Just qualitative observations. Answer the following questions:
- What is the position of the coil when the peaks in induced emf occur (the coil is horizontal, vertical, or in between)? Why?
- The coil has one end half-stripped. That was the design we needed for the operation of the motor. For the generator it is not necessary. Explain how this periodic interruption of the contact between the coil and the axle support influences the induced emf signal you observe. How this signal would have looked like if both ends of the coil were stripped?
- Imaging you strip both ends of the coil, disconnect iOLab device and short-circuit the axle supports. You kick a coil so that it makes several turns. Then you remove the magnet and give the coil an identical kick again (I am not asking you to do this experiment since it is impossible to produce two identical kicks). Will the coil rotate longer with or without magnet present? Explain.
Please note: this is a very simple model of a real electric generator. Commercial generators are much more sophisticated, but they use the same principle as our simple model.
Experiment 2: Magnetic field flux.
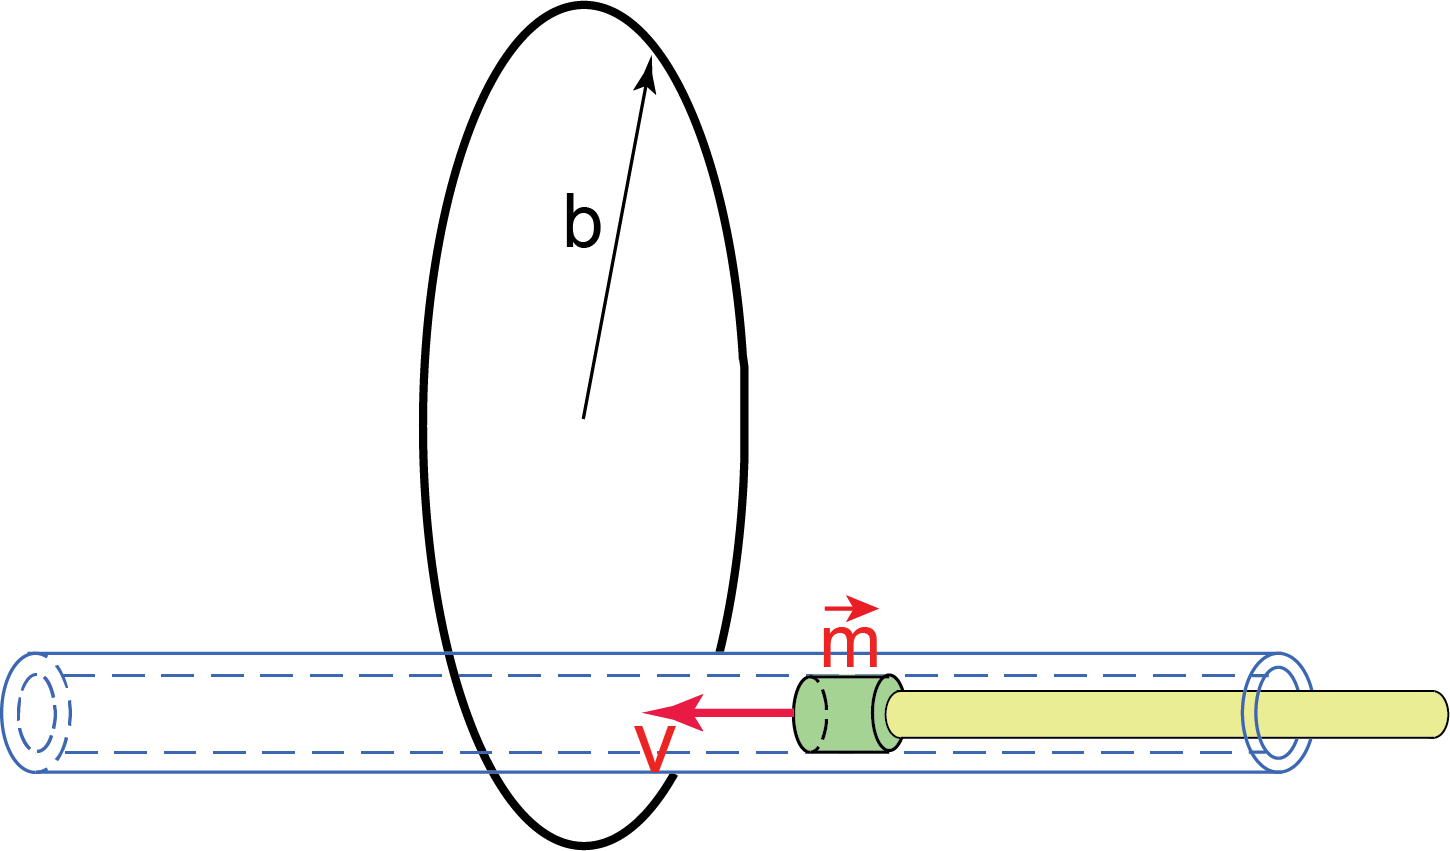
In this Experiment you will measure the flux through the circular loop of the magnetic field of the small magnet located in the center of the loop (see Figure M.1). You will then use the measured flux to determine the magnetic dipole moment of the magnet.
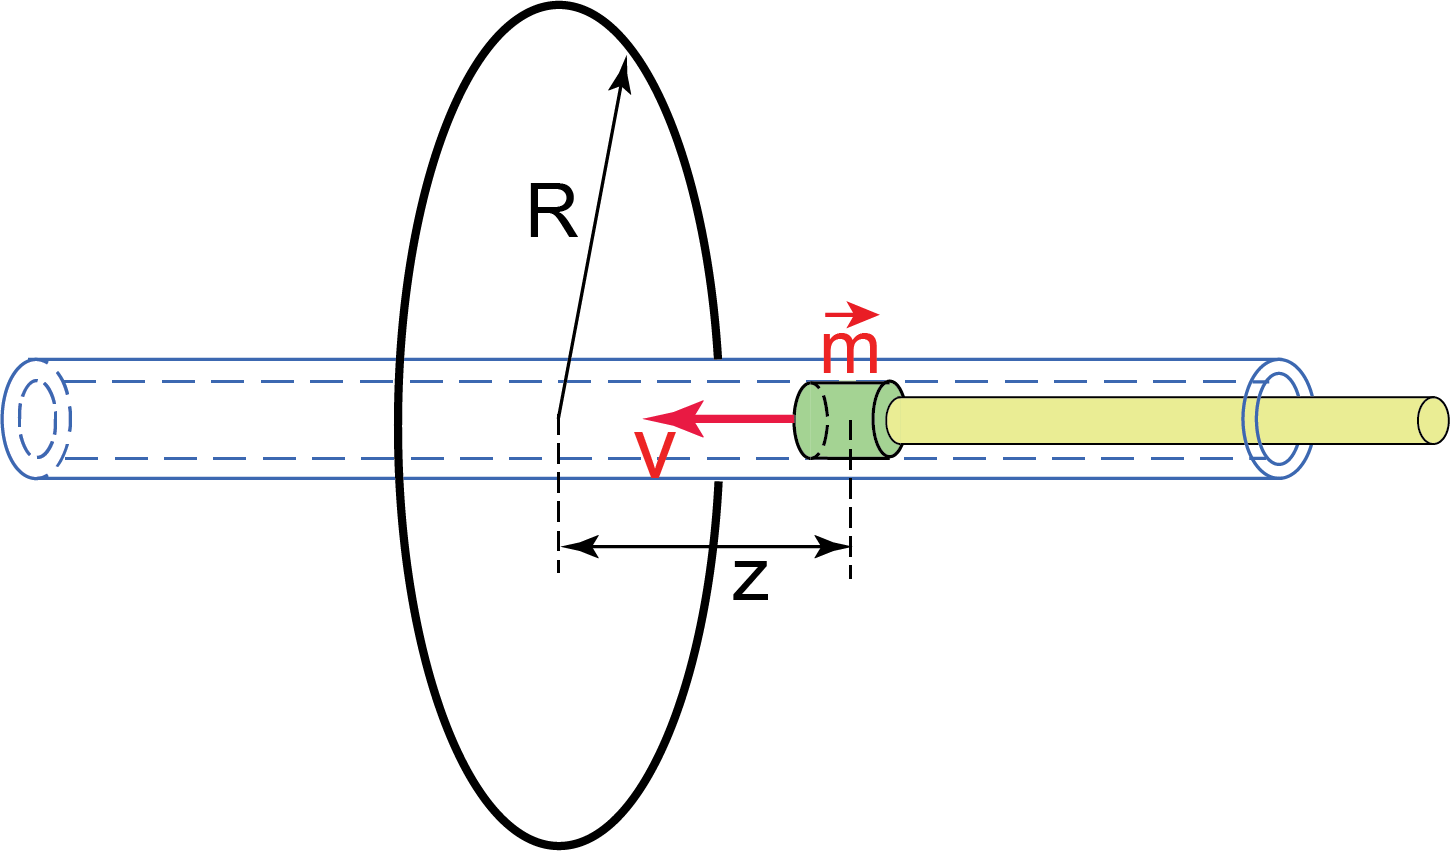
- Use the long piece of provided blue wire to make a circular loop with 4 or 5 turns of radius
 . Measure the diameter (and thus the radius
  ) of your loop with the ruler. Use provided shorter segments of white wire and scotch tape to secure your loop on the long plastic tube such that the tube passes through the center of the loop perpendicular to the loop’s plane as shown in Figure E.2. The loop should be located at the middle of the plastic tube.
 - Secure your tube with the attached loop at the edge of the table with scotch tape so that approximately half of the tube (including the loop) extends beyond the table.
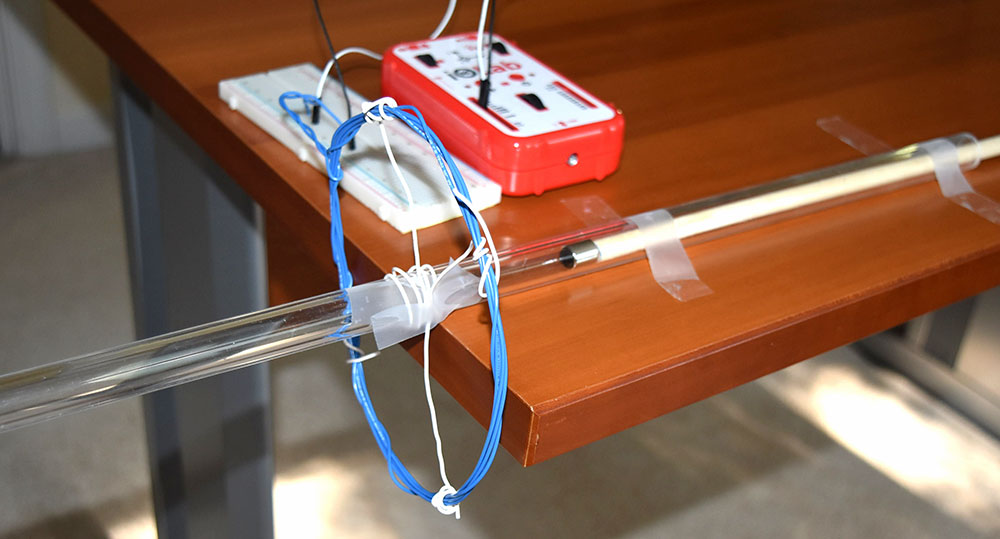
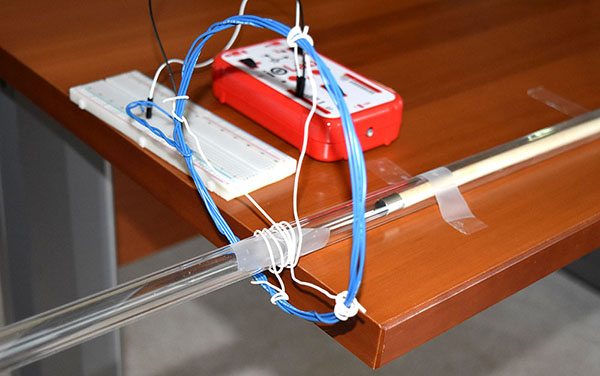
- Connect High Gain (G+ and G-) terminals of iOLab to your loop through the breadboard. The photo of the experimental setup is shown in Figure E.3. Activate High Gain sensor in the iOLab software.
- Insert blue magnet in the tube and place wooden rod behind it.
- Move your magnet through the tube with approximately constant speed. Observe emf induced in the loop. Repeat this experiment at least 5 times.
- Now we will analyze our data using Model 1. On your emf signal the time
 (when the magnet passes through the center of the loop) is the time when the emf curve crosses zero. Use statistic tool in iOLab software to integrate
  from some (distant enough) prior time to
  .
.  (see Model 1) equals to the value of this integral divided by the number of turns in your loop. Similarly, integrate
  from
from  to some (distant enough) time and divide resulting integral by the number of turns to obtain
  . Use (M.5) to calculate
  . Calculate
  for all your experimental runs, enter your data for
  in the spreadsheet and calculate the mean
  and standard deviation
  for your data series.
 - Use (M.1) to express magnetic moment
 in terms of
  ,
,  , and
, and  .Use resulting expression, your loop radius
  and the mean
  to calculate
  . Include a screenshot of one of your magnetic flux measurements into your report. Show your calculations of
  for one experimental run.
 - Now we will calculate the uncertainty of our magnetic moment
 calculation. The diameter measurement for your loop carries uncertainty – about
  . Therefore, the uncertainty for the radius
  measurement is
  . The uncertainty for your
  measurement is the standard deviation
  of your data series. Your expression for
  involves product
  . How do we calculate the uncertainty for the magnetic moment
  ? We combine relative uncertainties (see https://www.nde-ed.org/GeneralResources/Uncertainty/Combined.htm for the general rules on how to combine/propagate uncertainties in calculations). For two measured quantities
 and
and  their product
  is:
is: where
where  and
and 
(E. 1)
Therefore, for the uncertainty in the magnetic moment
 we have:
(E. 2)
- Include calculated value for the magnetic moment
 of the blue magnet and its uncertainty as
  in your report. Compare with corresponding values obtained in Lab 5. Do you have a good agreement between
  values obtained through different techniques?
 - Now analyze your experimental data
 with theoretical Model 2. For each experimental run use statistics tool to measure
  ,
,  ,
,  (see Figure M.6). Calculate magnetic moment
  using the expression you derived for this Model. Tip: theoretical model was designed for the loop with a single turn. When you substitute the emf amplitude you measured into your formula do not forget to divide it by the number of turns in your loop.
Show calculations of magnetic moment for one experimental run in your report, include screenshot of your measurement of
Calculate the mean ,
,  ,
,  .
. value obtained through Model 2. You do not need to calculate uncertainty in this part. Compare your mean magnetic moment
  obtained through Model 2 with the one you calculated through
  measurement (Model 1). Do you have a good agreement between results of these two models?
 - Repeat this Experiment with the black magnet - calculate its magnetic moment and its uncertainty with Model 1. Include in your report and compare with corresponding values obtained in Lab 5.
Experiment 3: off-center tube.
![]() . In your report:
. In your report:
- Compare obtained
 with the corresponding value you measured for this magnet moving through the center of the loop in Experiment 2. Provide qualitative (no formulas) explanation.
 - Is Model 1 used in this Experiment to obtain
 valid for the magnet moving along the line that is not axis of symmetry of the loop? Explain.
Experiment 4: Charge Pump.
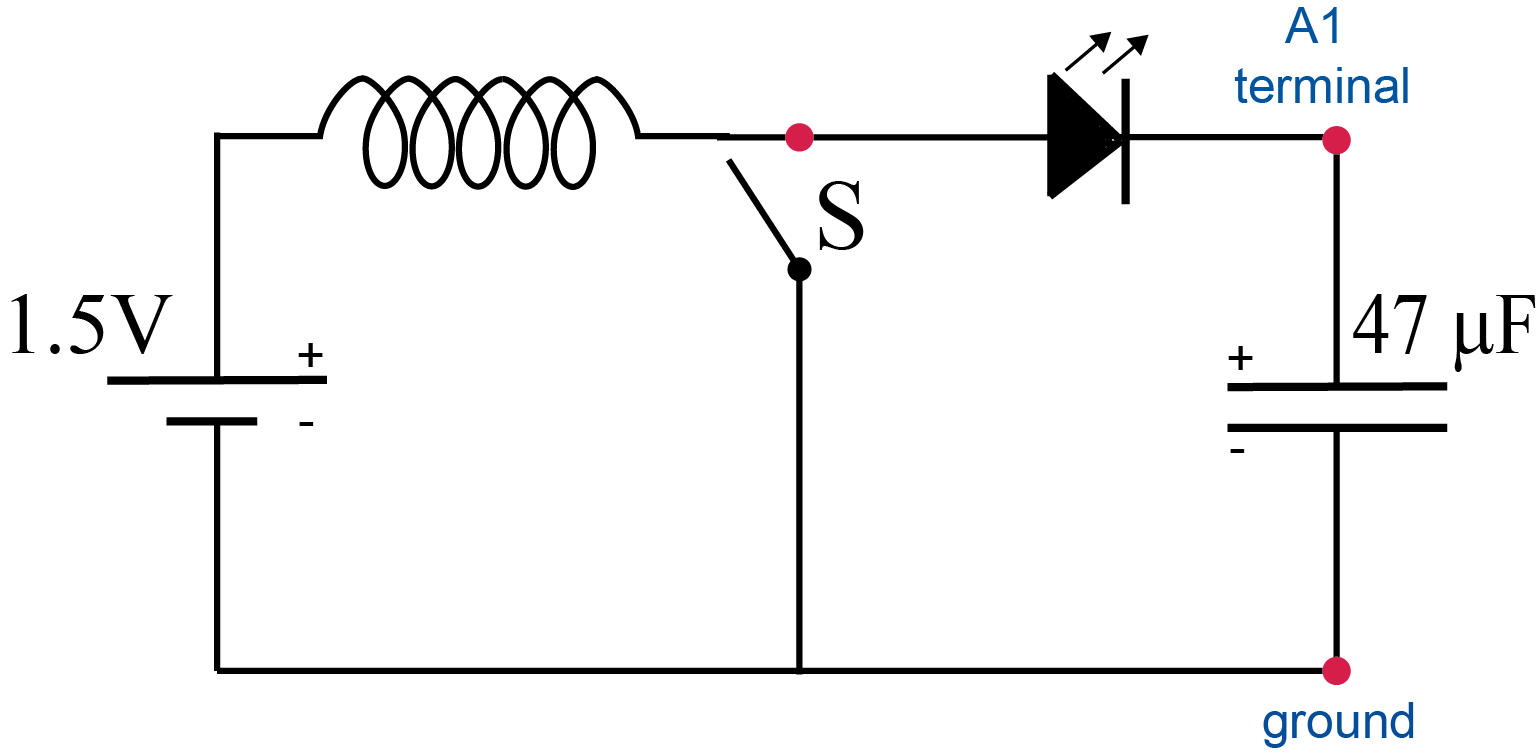
In this experiment we will build a simple charge pump that will enable us to use a single AA battery with the voltage of 1.5V to charge a capacitor to the voltage that exceeds that of the battery, for example 3 V.
The circuit we will use for our charge pump is shown in Figure E.6 (the battery and the coil have small resistances not shown in the diagram). At the beginning, with the switch S open, the current flows to the capacitor until it is fully charged, and at that point current stops.
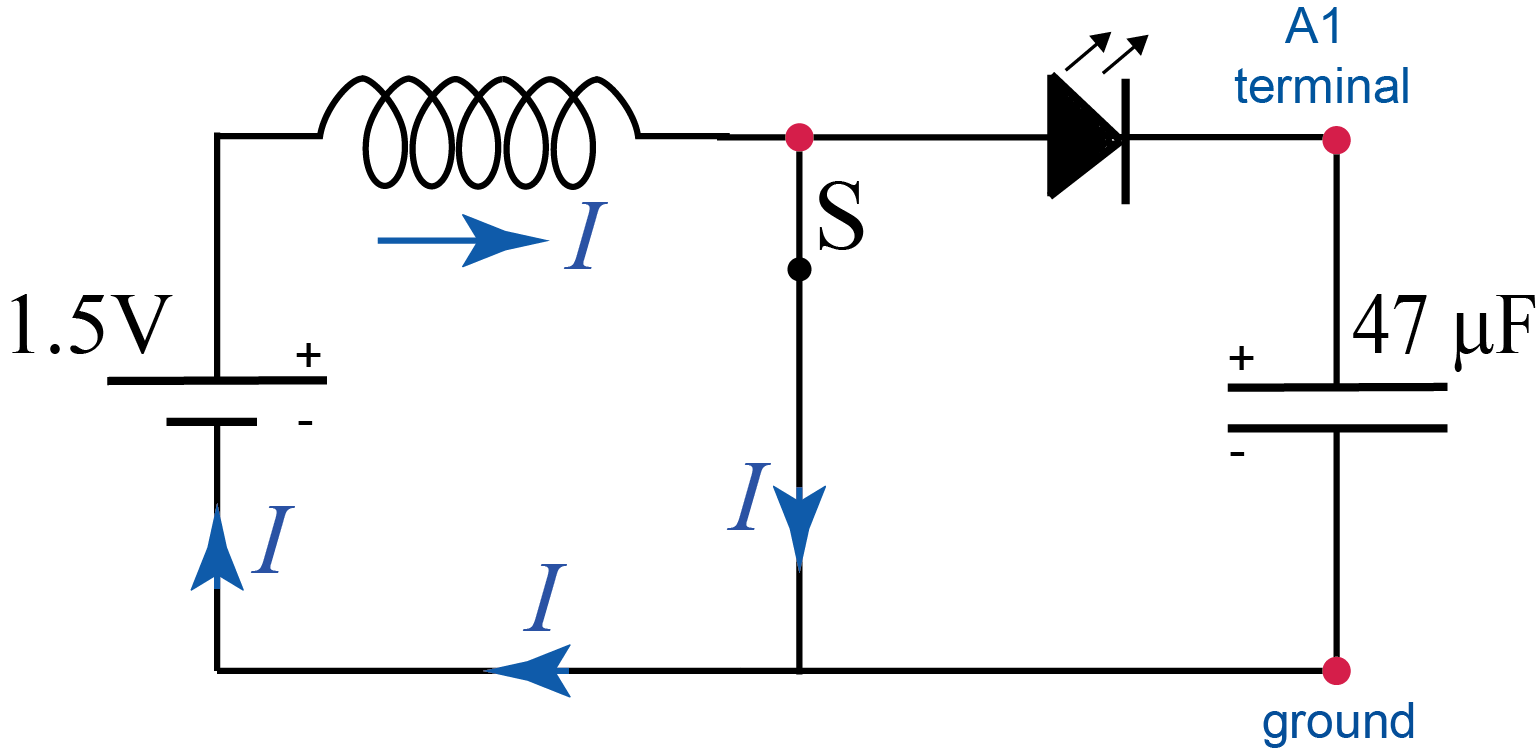
Now you close switch S (see Figure E.7). The current in the inductor re-establishes very quickly since the inductance of the coil is very small and the time constant for the resulting RL loop is very short. The diode and the capacitor are now short-circuited but the capacitor does not discharge because the diode does not let the current to flow in the opposite direction. Effectively, the diode works as a one-way directional valve in our charge pump allowing the current to only flow clockwise in our circuit.
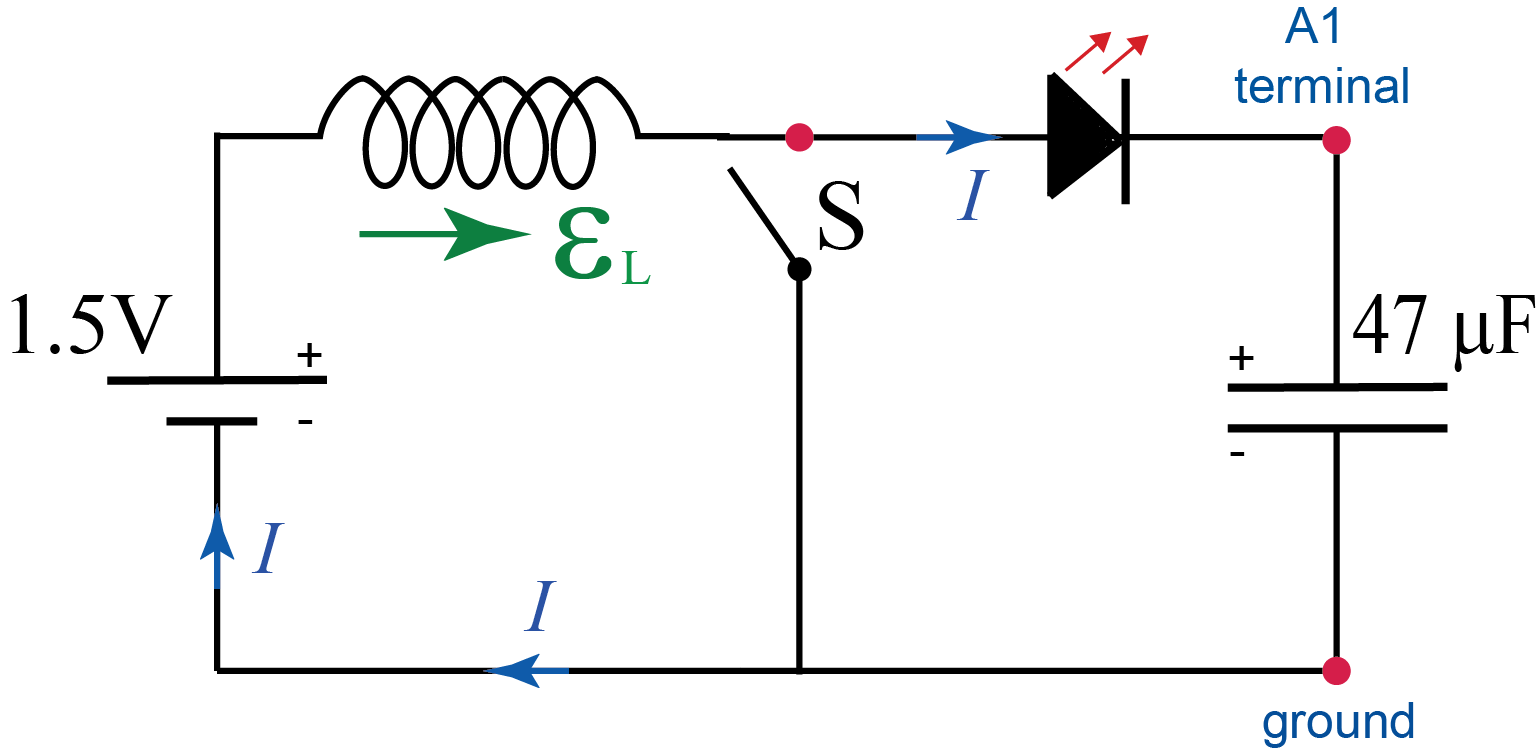
Now, with the current in the inductor established we re-open the switch (Figure E.8). This results in abrupt change in the circuit since now it again includes capacitor with certain voltage across it. Resulting abrupt decrease in current leads to the induced voltage across the inductor.
The direction of the induced emf in the inductor is such as to oppose the decrease of the current – that is the same as the direction of the battery emf. Thus, these two emfs add together, and for the short instance we have combined emf in the circuit that exceeds that of the capacitor. This results in a short impulse of current to the capacitor – that is additional charge is delivered to the capacitor thus increasing its voltage. The current quickly subsides but we may repeat this process several times closing and opening the switch. Every time some additional charge is delivered to the capacitor thus increasing its voltage (see Figure E.9).
- Construct the coil. Wrap the long blue wire around the pen about 15 times. This is the first layer. Carefully make 3 or 4 more layers over the first one until you used up all the wire except a few centimeters on both ends. Secure it with the scotch tape.
- Build the circuit shown in Figure E.6 with 47μF capacitor. While assembling the circuit pay attention to the polarity of both the capacitor and the diode. The longer terminals of both the capacitor and the diode should be connected to the higher potential than the shorter counterparts. Implement the switch using the connecting wire with one end connected to the negative terminal of the battery and with another end you may touch the terminal of the coil.
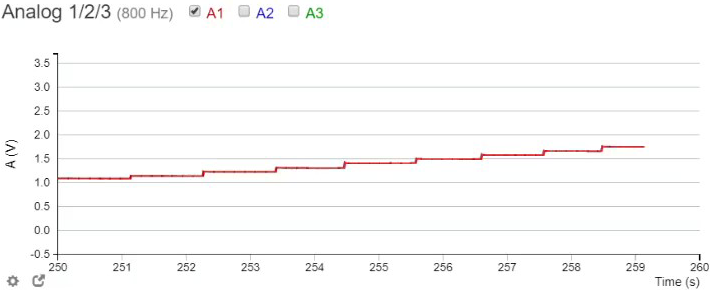
- Connect A1 terminal of the iOlab device so that it measures the voltage across the capacitor. Initially you see the voltage across the capacitor increase slowly. Close the switch (i.e. touch appropriate coil terminal with the wire connected to the negative terminal of the battery). Relatively large current should establish in the coil. Reopen the switch and observe the jump in the voltage across the capacitor while the LED blinks (indicating the voltage across it exceeds 2.2V, the forward voltage on this LED). Repeat closing and reopening the switch until you charge the capacitor to 3V.
- Your report should contain the screenshot of the stepwise voltage increase across the 47μF capacitor (from 0 to 3V). Repeat the same experiment with 470μF capacitor. Compare experiments with these two capacitors and explain the differences.
